Scripted plotting
Storing plots that describe the (RFI) quality of an observation can be useful for quality assessment.
Both rfigui and aoqplot have options that make it possible to save certain statistics or overview images.
The command-line options of these tools give access to these plotting capabilities from non-interactive pipelines or scripts.
When parameters are given on the command line that save images, the rfigui and aoqplot tools will not open their
default window and therefore do not require an X windows system to be running [1]. In other words, the tools
will run as non-interactive command line programs.
Both rfigui and aoqplot provide parameter --help, which will show a list of supported options.
rfigui
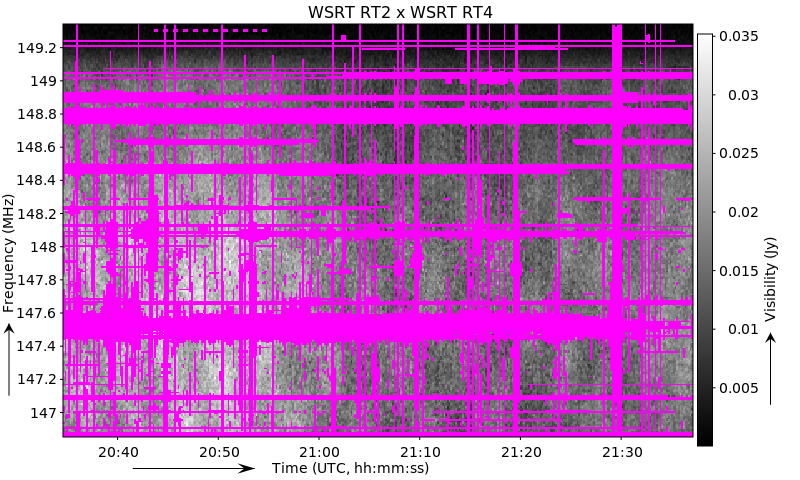
The rfigui tool can be used to save time-frequency “heatmap” images, that show the flux of the correlations in a two-dimensional time and frequency display. The syntax is as follows:
rfigui \
  -save-baseline <filename> <ant1> <ant2> <band> <seqindex>
Filename should end with an image extension. Supported formats are .png, .pdf and .svg. Note that .pdf and .svg are of higher quality than .png files. The created plots will by default be made from the “DATA” column. However, a different column can be selected with the option -data-column <name>. The following example will save the correlated data from antennas 1 and 3:
rfigui \
  -data-column CORRECTED_DATA \
  -save-baseline WSRT-RT2xRT4.pdf 1 3 0 0 3C196_spw5_sub1.MS/
Which creates the following pdf:
It is also possible to repeat the ‘-save-baseline’ option to save multiple images at once. This saves quite a few computations over saving the baselines one by one with separate rfigui calls.
aoqplot
The aoqplot syntax to save plots is as follows:
aoqplot -save <filename prefix> <statistic name>
Note that unlike rfigui, the aoqplot tool saves several images at once. The plots created are i) a per-baseline matrix plot; ii) a per antenna plot; iii) a spectrum; iv) a time-plot; and v) a time-frequency heatmap. The statistic name parameter is a case-sensitive name of the statistic that will be plotted over antenna/time/frequency, etc. The common statistics are: StandardDeviation, DStandardDeviation (=stddev of difference between channels), Variance, Mean, RFIPercentage, RFIRatio and Count (=visibility count). A full list of allowed statistics can be retrieved by typing aoquality liststats on the command line. However, not all allowed statistics are stored by default in a measurement set. This is an example aoqplot run:
aoqplot -save aartfaac-stddev StandardDeviation aartfaac-testobs.ms/
 (1/1) Adding aartfaac-testobs.ms/ to statistics...
Lowering time resolution...
Lowering frequency resolution...
Integrating baseline statistics to one channel...
Regridding time statistics...
Copying statistics...
Integrating time statistics to one channel...
Opening statistics panel...
Saving aartfaac-stddev-antennas.pdf...
Saving aartfaac-stddev-baselines.pdf...
Saving aartfaac-stddev-baselinelengths.pdf...
Saving aartfaac-stddev-timefrequency.pdf...
Saving aartfaac-stddev-time.pdf...
Saving aartfaac-stddev-frequency.pdf...
This is an example for the produced ‘baselines’ plot:
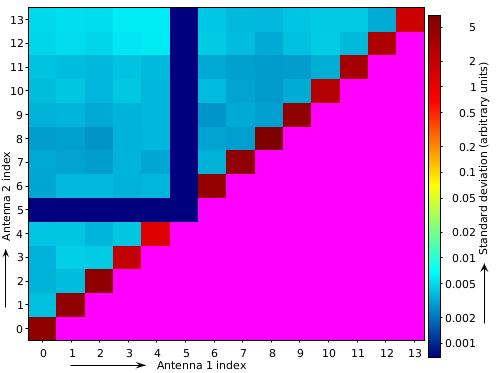
As can be seen from this image, antenna index 5 (WSRT RT5) is not working, and the autocorrelations show more power (as they should). Note that aoqplot uses the quality statistics tables inside the measurement set. These are normally produced by tools like DPPP, cotter or aartfaac2ms; however, if a measurement set is not produced by one of those tools, it is necessary to create these tables manually. This can be done with the aoquality collect <obs.ms> command.
| [1] | Older versions of rfigui and aoqplot would require an X window system to be running even when running in command line mode. However, that was resolved in AOFlagger [version 2.10](changelog-2.10.0). |